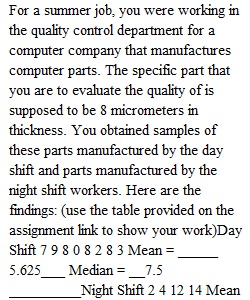


Q Page of 2 ZOOM Chapter 8: Recap Assignment 1. For a summer job, you were working in the quality control department for a computer company that manufactures computer parts. The specific part that you are to evaluate the quality of is supposed to be 8 micrometers in thickness. You obtained samples of these parts manufactured by the day shift and parts manufactured by the night shift workers. Here are the findings: (use the table provided on the assignment link to show your work) Day Shift 7 9 8 0 8 2 8 3 Mean = _________ Median = ___________ Night Shift 2 4 12 14 Mean = _________ Median = ___________ A. Determine the mean and median for each shift and compare these with the desired level of 8 micrometers. Which shifts average was closer to the target? ___________ B. If you needed to use one of these parts in your own computer on which shift would you prefer the part to have been manufactured? ______________ Why? C. In order to describe the variability of a set of data, a simple measure is to compute the Range. In statistical jargon, the Range is the gap between the largest and smallest value in the data set. Calculate the range for each shift. Day shift: Range = ___________ Night shift: Range = _____________ • A more sophisticated way of describing the variability of a dataset is based on the notion of deviation from the mean. For example: If the class average on a history test is 70, but you made a score of 87, your deviation would be +17. If your friend scored a 60 on the test, his or her deviation would be -10. Give the deviation from the mean for each part made on the night shift. • Data value: 2 4 12 14 • Deviation: ____ _____ _____ ______ 2. Measures of central tendency: 1. The following date represent the scores achieved by students on their math quizzes: 68, 55, 70, 62, 71, 58, 81, 82, 63, 79 2. The following data represent the number of pop-up advertisements received by 10 families during the past month. Calculate the mean number of advertisements received by each family during the month: 43, 37, 35, 30, 41, 23, 33, 31, 16, 21 a. Calculate the mean, median, mode and standard deviation of the data sets. b. Find the range and variance of the data sets. c. (Use the table provided in the assignment submission link to show your work for the mean, median, mode, SD and variance) (N=____) X X bar (mean) X-X bar ( X-X bar) squared Total: sum of X= sum of X - X bar should always be= 0 sum of (X -Xbar) squared= Mean: Variance Is = Sqrt SD Is =
View Related Questions